
Hubsessed Office Hours - Reporting and Dashboards - Oct 7, 2026
Hosts: Joshua Oakes, Madelyn Donovan
Wednesday, October 7, 2026
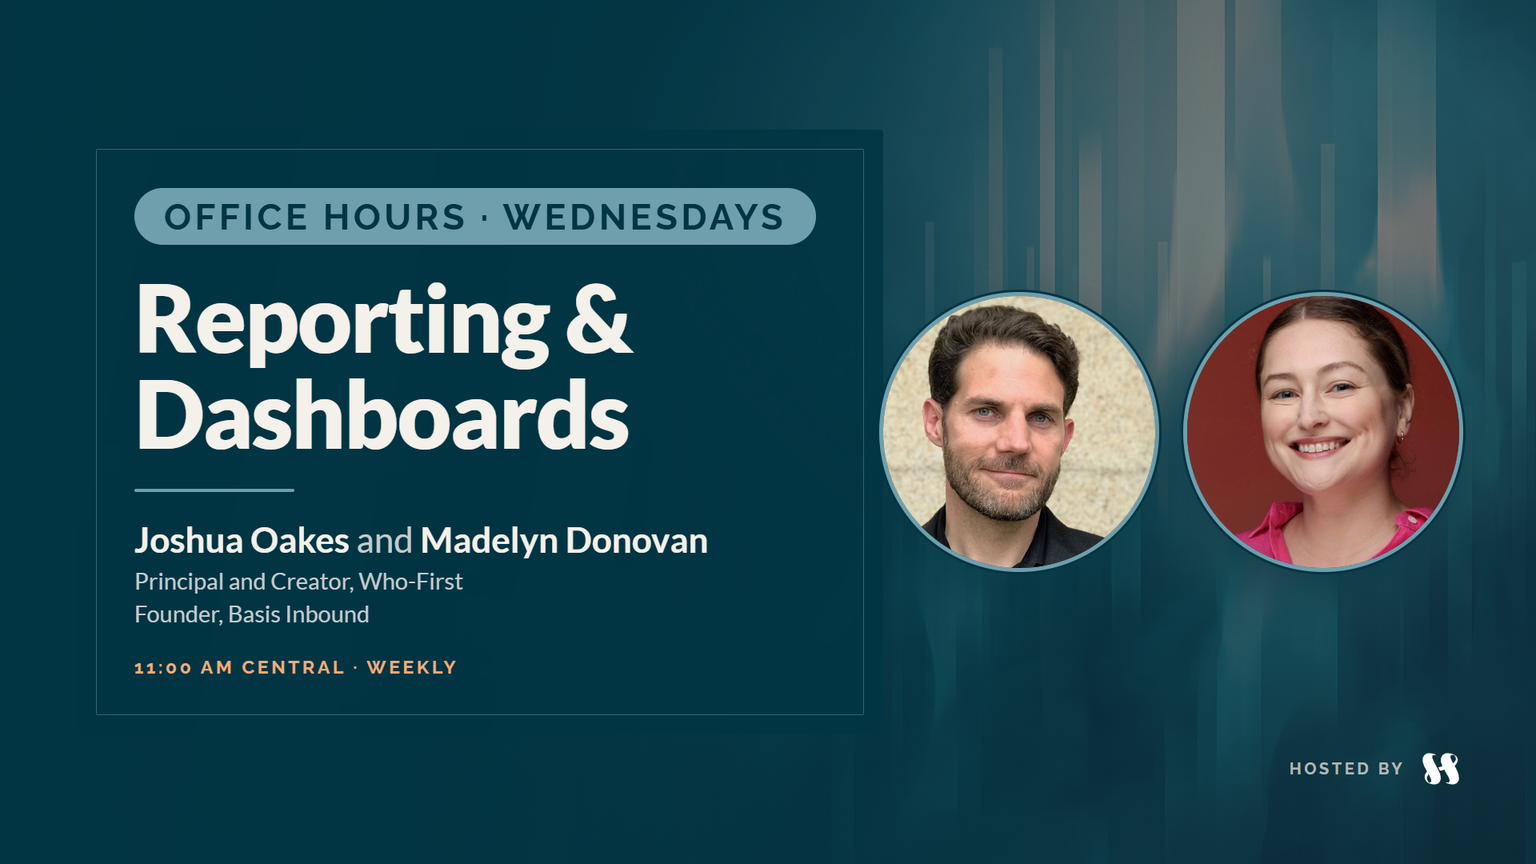
Joshua Oakes and Madelyn Donovan open the Reporting & Dashboards lane: agreeing on a report's definitions before building it, numbers versus data, color that helps people connect the dots, reports on records, the new report view on index pages, and a naming pattern for saved reports.
Key takeaways
Ask what a report is for, and agree on its definitions with the people asking, before you build it.
For any stage-to-stage report, settle the denominator first. Joshua: misleading reports are more dangerous than no data.
Numbers are not data until they match how the business really works. A table view and report view can show how often a key property is empty.
Use color on purpose, so people can connect a summary with its detail and a rep keeps one color across every report.
Reports about one record belong on that record; reports about all of your data belong on a dashboard.
The report view on index pages answers quick questions from the table's own filters and columns, without another saved report.
Name saved reports Intent - Breakdown - Timescale, with short timescale codes such as LW, TM or T90, so similar reports stay easy to tell apart.
Before you change a report, check the warning about the other dashboards it appears on.
Questions answered
- 00:00Welcome to Reporting & Dashboards
- 01:57The most rewarding report lately
- 06:47People don't always know what they need from a report
- 08:47Start with the denominator
- 11:38Numbers versus data
- 12:59Color that helps people connect the dots
- 17:21Maslow's hierarchy of reporting needs
- 17:52Chris's question: reports versus index page views
- 23:58The report view on index pages
- 29:32Chris's question: naming saved reports
- 31:13Intent, breakdown, timescale
- 36:12HubSpot's templated report names and the breakdown
- 38:11A table beside the chart
- 39:59When one report sits on several dashboards
- 41:35New features, goals and forecasting
- 43:10Color themes and a wish list
- 45:59Pattern fills
- 47:15Property colors and conditional formatting
- 48:53Bring your questions
Transcript
This transcript was generated by AI and may contain errors. It is provided to help you skim and search the conversation.
Related episodes
 Wednesday, October 7, 2026, with Casey Hawkins, Chris Carolan, and Zach HussionAnother Orange Morning · Wednesday, October 7, 2026
 Tuesday, October 6, 2026, with Casey Hawkins, Chris Carolan, and Ryan GinsbergAnother Orange Morning · Tuesday, October 6, 2026
 Monday, October 5, 2026, with Casey Hawkins, Chris Carolan, and Joshua OakesAnother Orange Morning · Monday, October 5, 2026